Wednesday, December 9, 2015

My take on the spare phone intercom

There are numerous tutorials online outlining methods of using landline telephones to make simple intercom systems.  While all that's really necessary to provide a talk current is a 9v battery and a resistor, ringing or otherwise signaling a call prompt to a remote station is often beyond the scope of simple designs.  About a decade ago, I put together an intercom system between the shop and the house; since I had to do some service to it recently, I figured I'll write a thing about it. 

The design is similar to the second circuit described here.  Picking up one phone causes the buzzer at the opposite station to sound.  Once both phones are off-hook, the buzzer stops.  My design changes are based around a lower voltage power supply, demonstrating that the design is certainly flexible.  The station phones can be any sort of landline phone: cordless, electronic, or just an old dumb rotary made 80 years ago.  Use twisted pair for the link cable.  Length is not likely limited in your application.  I'm using about 200 yards of cable between stations.  Any attenuation can be compensated by adjusting R3 to compensate (trim to about 25mA off-hook).


The buzzers are self-oscillating piezo buzzers.  The ones I'm using begin oscillating at about 1.5v, and as with many buzzers of this type, they can be tuned by placing a reflector of some sort at an adjustable distance in front of the aperture (I just used a tab of thin aluminum sheet).  This improves buzzer volumes at low voltages.  With higher supply voltages (24v), this may be less necessary.

Resistors R2 and R4 are used to reduce sensitivity to leakage currents or induced voltage in a long or heavily weathered link cable.  Without these bleeder resistors, a waterlogged outdoor cable or a long run of untwisted cable may result in the local station occasionally beeping weakly when both phones are on-hook.  To see why, note that the two station networks form a series voltage divider.  Any shunt conductance in the line tends to bias this voltage divider such that the local station is closer to its zener voltage than the remote station.  Since a telephone is essentially open circuit when on-hook, the divider network is very sensitive to even small shunt conductances.  Adding bleeder resistors diminishes the influence of such system defects.  For short indoor runs, they are likely unnecessary.

Switches S1 and S2 allow the station phones to function as regular landline phones.  Leaving the phone switched to the phone line does not prevent an intercom call prompt from being received.  This connection can be omitted if no landline service is desired.

Capacitors C1 and C3 allow the remote buzzer tone to be heard from the calling station. C2 is for supply bypass.  The LED can be omitted if undesired.  Use whatever power supply is handy; talk current is only 20-30 mA.  I simply used the power supply that was already in the equipment I stripped for the enclosure.

The local station in a repurposed QINGEN enclosure (and a 1941 Uniphone)

Again, this article is not unique.  Perhaps the one thing I can offer is the fact that this as-built design does function over long distances, with various phones, and for over a decade.  That's more than a 9v battery design will provide.

Saturday, November 14, 2015

The problem with finding boundary chroma in CIELAB

Previously I had mentioned the use of CIELCHab and HuSL for image blending and adjustment.  Whether using LCH or a HuSL method, my approach to these operations requires the knowledge of the maximum chroma of the sRGB gamut as a function of L and H.  This isn't a simple task in CIELAB.

The extent of sRGB in CIELUV (left) and CIELAB (right)

To see why it's problematic, let's start with an existing method.  The reference implementation of HuSL uses LCHuv (CIELUV) as the parent space instead of LCHab.  The idea is the same.  For the L and H of a given pixel, we can calculate the maximum chroma for the purpose of normalization and clamping.  The approach used here is to simply calculate six boundary curves representing the intersection of the RGB gamut faces with the plane of constant L containing the given pixel.  The rest is the calculations of line-line intersections and distance minimization.

function Cout=luvboundcalc(L,H)
    % this function uses the method used by the other implementations
    % of HuSL in LUV
    Axyz=[3.240454162114103 -1.537138512797715 -0.49853140955601; ... 
        -0.96926603050518 1.876010845446694 0.041556017530349; ...
        0.055643430959114 -0.20402591351675 1.057225188223179];
    ka=903.2962962962963;
    ep=0.0088564516790356308;
    ref=[0 1];
    Cout=ones(size(L))*realmax;

    Hradians=H*pi/180;
    sinH=sin(Hradians);
    cosH=cos(Hradians);
    sub1=(L+16).^3/1560896;
    mask=(sub1>ep);
    sub2=sub1;
    sub2(~mask)=L(~mask)/ka;
    
    for r=1:3;
        row=Axyz(r,:);
        a1=row(1);
        a2=row(2);
        a3=row(3);
        top=(11120499*a1 + 11700000*a2 + 12739311*a3)*sub2;
        rbot=9608480*a3 - 1921696*a2;
        lbot=1441272*a3 - 4323816*a1;
        bot=(rbot.*sinH + lbot.*cosH).*sub2;
        
        for k=1:2;
            C=L.*(top - 11700000*ref(k))./(bot + 1921696*sinH*ref(k));
            mask=(C>0 & C<Cout);
            Cout(mask)=C(mask);
        end
    end
    Cout=min(Cout,175.2);
end

Chroma map for CIELUV at L=75 showing linear boundary curves
Although one might not suspect it at first glance, the level curves of this odd shape are indeed straight lines, and the described method works well.  We can calculate the maximal chroma for every pixel and use it to normalize or truncate an image in whole, or we can precalculate a lookup table if it makes things quicker.

The lookup table data for CIELCHuv
Discussion of HuSL elsewhere, and my own idle curiosity had to question why there was no implementation in LCHab.  Maybe I don't know enough about why it would be a dumb idea, but I like the symmetry of having both options.  Besides, if I want to do LCHab>RGB conversions, I'd want such a bounding method for the purposes of truncation anyway; again, maybe I just don't know enough.

Very quickly after trying to produce my own HuSL method in LAB, I had to wonder if the choice of LUV was in part a matter of convenience.  Unlike LUV, the level curves and meridians of the projected RGB cube are not linear.  Could we break this problem up by angle intervals and create a piecewise solution?  That's a bit problematic, as the face intersections don't lie neatly on a curve of constant H.  It would be a game of finding interval endpoints which straddle the face intersections, calculating an excess of data and then minimizing.  I start to question whether this will be costly. 

Chroma map for CIELAB at L=75, showing nonlinear boundary curves
In the process of trying to shove the LAB>RGB conversions through a solver to find a boundary curve equation, I noticed something.  At points near the yellow corner, the boundary function can't be solved as a simple function of H and L.  In simple terms, at these points there exist multiple solutions for the R=1 curve, and contrary to the required solver behavior when handling solutions from multiple curves, we want the maximum solution.

Chroma map for CIELAB at L=97.14, corresponding to the yellow corner
Detail of the above map, for H=90-120 degrees


Radials cast from the neutral axis to the primary-secondary edges intersect the R=1 face
I have yet to come up with even a conditional piecewise analytic solution. Looking around, I have not found any other approach involving an analytic solution of this bounding problem.  I ended up using a bisection solver to calculate the boundary chroma, though this approach is still very slow and a naive approach has issues converging to the apex.  Due to the undercut, convergence at the very edge would require a infinitesimally small initial step size.

I ended up performing additional calculations in the ROI near the corner, solving the R=1, G=1, and B=0 faces independently and forming a logical combination to locate the exact edge.  By this method, the numeric solver can converge to the very edge even with a large initial step size.

The lookup table data for CIELCHab, note vertical face near the problem area

function Cout=labboundcalc(L,H)
    % LUV approach won't be simple in LAB, since level curves and meridians are all nonlinear
    % furthermore, yellow corner is actually undercut and convergence at the edge 
    broadroi=H>85 & H<114 & L>85;
    pastcorner=(H-5)<L;
    ROI=(broadroi & ~pastcorner);
    
    % find boundary for entire area
    % then calculate logical combination of faces near ROI
    tic
    Cout=labsolver(L,H,1);    
    if any(ROI)
        Cbg=labsolver(L(ROI),H(ROI),2);
        Cr=labsolver(L(ROI),H(ROI),3);

        edge=(Cbg>=Cr);
        Croi=Cout(ROI);
        Croi(edge)=Cbg(edge);
        Cout(ROI)=Croi;
    end
    toc
end

function Cout=labsolver(L,H,mode)
    % adapted bisection solver for LAB
    
    % initial boundary generation for LAB
    Lc0=[0 5 33 61 67 88 98 100];
    Cc0=[30 60 135 115 95 119 97 15]+5;
    Lc=linspace(0,100);
    Cc=interp1(Lc0,Cc0,Lc);
    ind=L/100*(length(Lc)-1);
    Lp=round(ind)+1;
    
    s=size(H);
    C=Cc(Lp);
    C=reshape(C,s);
        
    % initial step sizes
    cstep=10;
    stepsize=-ones(s)*cstep;
    
    limitdelta=1E-7*prod(s);
    lastCsum=abs(sum(sum(C)));
    unmatched=true;
    out=true(s);
    first=true;
    while unmatched
        % CONVERSION MUST PASS OOG VALUES
        % bypass gamma correction for speed (results converge at the faces)
        rgb=lch2rgb(cat(3,L,C,H),'lab','nogc');

        % is point in-gamut?
        wasout=out;
        switch mode
            case 1
                out=(any(rgb<0,3) | any(rgb>1,3));
            case 2
                out=rgb(:,:,3)<0 | rgb(:,:,2)>1;
            case 3
                out=rgb(:,:,1)>1 | C<cstep;
                if first
                    fout=out;
                    first=false;
                end
        end
        neg=C<0;
        big=C>140;
        out=out & ~neg;

        change=xor(wasout,out);
        stepsize(change)=-stepsize(change)/2;
        stepsize(big)=-abs(stepsize(big));
        stepsize(neg)=abs(stepsize(neg));

        C=C+stepsize;

        Csum=abs(sum(sum(C)));
        dC=abs(Csum-lastCsum)
        lastCsum=Csum;

        if dC<limitdelta 
            unmatched=false;
        end
    end
    Cout=max(C,0);
    
    if mode==3
        Cout(fout)=150;
    end
end

This is the approach used by the function maxchroma() in my Matlab image mangling toolbox.  As mentioned, the HuSL and LCH conversion tools are based on this function.

Friday, November 6, 2015

Create a uniform colormap for plots in Matlab

This is just a quick one, and I know that there are plenty of other methods for doing this.  I figured that if I'm going to demonstrate that the symmetric normalized HuSLp and HSYp color models can be used for image editing, I might as well show other uses as well.

The symmetric models HuSLp (CIELUV and CIELAB) and HSYp (YPbPr)
Recall the nonuniformity addressed by the rotationally-symmetric normalization of HuSLp and HSYp.  While HuSL and HSY are attempts to bring the convenience of models like HSL and HSV to other, more uniform color spaces (e.g. CIELAB, CIELUV), their normalization method distorts the relationship between S and C.  A path of constant normalized saturation now has a radius dependent on hue.  To regain the uniformity of the parent space, HuSLp and HSYp are normalized to the maximal rotationally symmetric subset of the projected RGB space.  This means that HuSLp and HSYp retain visual uniformity, but at the expense of maximum chroma range.

Surfaces of maximum S: HSL (top); HuSLab, HSY (middle); HuSLpab, HSYp (bottom)

Comparing HuSL and HSY to HSL, we see the difficulty of naive color selection by simply varying hue alone.  The low resolution of these gradients makes the brightness variation much easier to notice.  The HuSLp and HSYp maps appear as a series of uniform rows.  Color selection in these maps is limited, but greatly simplified.  While care can be taken to make colormaps of higher chroma from discontinuous paths in CIELAB or YPbPr, these generic image conversion methods can be used quite easily with adequate results.

In this example, we create three colormaps corresponding to the hue angles of the primary and secondary colors.  Note the brightness variation in HSL; anyone who has spent any time making plots in Matlab has probably found themselves avoiding certain named line colors due to their poor visibility ('b' on black, 'y' on white).  While notably less saturated, the HSYp and HuSLp colormaps yield lines which are all equally visible.  Here, the HuSLp method uses CIELUV simply because the saturated corners of the RGB space are not 60 degrees apart in CIELAB. Also, take note that I'm inverting colors in the plot() call and in the imwrite() call because I'm operating with an inverted X display.

steps=6;

H=0:360/steps:(360-360/steps);
K=ones(size(H));

hslset=permute(colorspace('<hsl',cat(3,H,K,K*0.5)),[2 3 1]);
hsypset=permute(hsy2rgb(cat(3,H,K,K*0.6),'pastel'),[2 3 1]);
huslpset=permute(husl2rgb(cat(3,H,K*100,K*65),'luvp','aligned'),[2 3 1]);

lw=2;
x=0:0.01:1.4;
os=2;
d=9;
sl=1.2;
subplot_tight(1,1,1);
for n=1:1:steps;
    plot(x,     (atan(x/(n/d))-sl*x),'color',1-hslset(n,:),'linewidth',lw); hold on;
    plot(x,    -(atan(x/(n/d))-sl*x),'color',1-hslset(n,:),'linewidth',lw); hold on;
    plot(x,1*os+(atan(x/(n/d))-sl*x),'color',1-hsypset(n,:),'linewidth',lw); hold on;
    plot(x,1*os-(atan(x/(n/d))-sl*x),'color',1-hsypset(n,:),'linewidth',lw); hold on;
    plot(x,2*os+(atan(x/(n/d))-sl*x),'color',1-huslpset(n,:),'linewidth',lw); hold on;
    plot(x,2*os-(atan(x/(n/d))-sl*x),'color',1-huslpset(n,:),'linewidth',lw); hold on;
end
view(-90, 90);
set(gca,'ydir','reverse');

to=-0.45;
text(1,-to  ,'HSL','fontsize',16,'fontweight','bold');
text(1,-to+1*os,'HSYp','fontsize',16,'fontweight','bold');
text(1,-to+2*os,'HuSLpuv','fontsize',16,'fontweight','bold');

frame=getframe;
imwrite(255-frame.cdata,'blogshit/colormaps1.png','png');

Plots using colormaps generated in HSL, HSYp, HuSLp
Certainly one has to weigh uniformity against the ability to discriminate plot colors.  Strategic selection of colors based on adjacency of plot objects is often unavoidable, and at some point, one has to ask how many things should even be in a plot before a different approach to visualization is more appropriate.  Perhaps these HuSLp/HSYp palettes would be even more appropriate for creating color themes for your favorite terminal emulator.

Maybe I'll do more to extend these tools toward making discontinuous color sets at higher chroma, but I think there are plenty of people working on that already.  Then again, it's not like I'm unaccustomed to reinventing wheels.  It's not like I have anything better to do, either.

Thursday, November 5, 2015

More thoughts on the 'color' blend mode

In the previous post, I discussed the 'color' image blend mode as used by GIMP and my efforts in Matlab to make a more useful variation.  To recap, methods such as HSV, HSI, and HSL in general offer poor separation of color and brightness information.  Of these methods, HSL tends to be the most useful for color adjustment and blending due to the symmetry of its saturation space, despite the fact that L is a poorer representation of image brightness than I.  Unconstrained operation in other color spaces (LAB, LUV, YPbPr) leaves us with the problem of how to deal with out-of-gamut conditions on conversion back to RGB.  Calculating boundary chroma and performing data truncation prior to RGB conversion can solve the problems caused by out-of-gamut points, resulting in good retention of background brightness.

When I had originally approached the use of LCH for image blending operations, I began by using a constrained and normalized version of LCH known originally as HuSL (now called HSLuv).  For a speed increase I also used a normalized polar version of YPbPr I refer to as HSY.  In these variations, saturation is normalized to the chroma range of the projected RGB space.  This is convenient and solves most of the same issues which a constrained LCH method solves.  It offers a few conveniences and features, but it has some weaknesses as well.  The normalization of C causes colors of constant S to no longer have a uniformity of appearance, but repeated hue adjustments do not cause chroma compression as with LCH truncation.

The projection of RGB in CIELAB and YPbPr as the extent of HuSLab and HSY
One of the drawbacks of normalizing or bounding chroma to the extent of the projected RGB space in LCH is that only a fraction of the projected RGB space lies on continuous locus of constant chroma. There exists only a small subset of the RGB space wherein color points can be subject to arbitrary hue rotation without leaving the gamut and having their chroma changed by truncation.  This maximal rotationally-symmetric boundary defines the normalizing chroma used for HuSLp, a variation of HuSL wherein the uniformity of the parent space (LAB or LUV) is retained.  As HuSLp and HSYp are subsets of the projected RGB space, they obviously cannot specify the full range of RGB colors.  Specifically, they are restricted to colors near the neutral axis, hence the suffix denoting pastel.  Compared to HuSLp, HSYp is not as uniform, but it has access to a greater fraction of the RGB space than HuSLp in either CIELAB or CIELUV modes.

Maximal biconic subsets of RGB in CIELUV, CIELAB, YPbPr
Uniformity in HuSLp (LAB): surfaces of 100% S and 50% L
Uniformity in HSYp: surfaces of 100% S and 50% Y
While this makes HuSLp and HSYp useful for color selection tasks, they are also useful for image editing so long as the chroma limiting is acceptable. Consider a color blending task with highly saturated foreground.  With its larger color range, let us compare a color blend in HSYp and LCHab.

Extreme test foreground and background
Color blends in CIELCHab and HSYp

While the limitations of HSYp are noticeable, the benefits are far more striking in this case.  The blue, red, and green stripes are moderated and the image regains its depth. 

To be realistic, this use-case is impractical but for testing.  A foreground with moderated colors would be less influenced by the limited range of HSYp.  For a sufficiently desaturated foreground, HSYp blending would produce results similar to a LCH blend, but it may still be quite a bit faster.  The major convenience of HSYp color blending is simply that the chroma is always compressed to the maximal uniform boundary.  There is no need to tweak foreground saturation to prevent uneven results.

Obviously, using stripes makes it difficult to produce a pleasing blend in any case, but that's kind of the point when testing.  In general, image editing operations need to consider content as much as method.  Blending a broad range of saturated hues with a photographic scene tends to create results which defy a viewer's expectations of reality.  Seeing a person with a purple face or a wood table lit with rainbow light doesn't make any sense to a pattern-recognition machine built on earth.

The image manipulation toolbox I've posted contains HSYp and HuSLp conversion tools, as well as support for these methods in the related image blending function (imblend) and the color adjustment function (imtweak). 

Sunday, November 1, 2015

Exploring the 'color' blend mode

In my ongoing adventures in creating image manipulation tools for Matlab, I have spent quite a bit of time getting desirable behavior from blending and adjustment tools.  Although most of these problems share a common set of core difficulties, perhaps one of the more intuitive ways to explore the issue is through the common "color" layer blending mode.


In image editing tools such as GIMP and Photoshop, image layers can be combined or blended using different pixel blending modes.  While modes such as the contrast enhancing modes don't suggest their operating methods so directly, certainly the component and arithmetic modes do.  Addition and division modes suggest the underlying math.  Hue and saturation suggest the channels to be transferred between foreground and background.  The detail-oriented observer might begin to raise questions at this point.  Hue? Saturation?  In what model are we working?

What about the 'color' mode?  Mere observation suggests that it's a combination of hue and saturation information being transferred, but again, the details are critically important. Various sources online suggest that this mode performs a HS transfer in HSV... or HSB... or HSL... or HSY?  One begins to wonder if anybody knows what they're talking about.

As my experience lies with GIMP, I based my expectations on its behavior.  Certainly, I can't test my blending algo against software I don't have; however, it might be worth keeping in mind that other suites may use different approaches.  The passing impression of online resources suggests that GIMP uses HSV or HSL, Photoshop uses CIELAB, and according to simplefilter.de, PaintShopPro uses some bastard HSL/HSY swap that has people so baffled that they ask questions of forums only to get more nonsensical guidance.   Let's sort this out as best we can by simple experiment.

I assume at this point a few things about what is desired.  Forgive my loose language hereon, but in this pixel blending mode, what should be transferred is the chroma information independent of the luminosity-related information.  In other words, the hue and colorfulness should change, but not the perceived brightness.  White should remain white, black should remain black.  Acronyms make it sound like a simple task, don't they?

Let's start with HSV, HSL, and HSI.  These are polar models used to express the content of the sRGB color space.  The convenience of these familiar models is simply the manner in which their polar format allows intuitive selection and adjustment of colors.

HSV is commonly visualized as a hexagonal cone or prism defined by piecewise math.  HSI is expressed as a cylinder or cone defined by simple trigonometry.  HSL is often described as a hexagonal bicone.  What's with all the different geometry?  All we want to do is separate HS from L/V/I, right?  Feel free to look at the math, but I think it's more valuable to the novice (me) to see how the isosurfaces associated with these models are projected into the sRGB space.

Isosurfaces of Value and Intensity as projected into the RGB cube

Value, the V in HSV, is defined as the the maximum of the RGB channels.  This means that the isosurfaces of V are cube shells in RGB.  Intensity (I in HSI) is the simple average of the channels.  This translates to planar isosurfaces.  At this point, it might start to look like HSI would provide more meaningful separation of color information from brightness information.  Does it make sense that [1 1 1] and [1 0 0] have the same brightness metric as they do in HSV?  Let's try to do an HS swap in these models and see what happens.

Foreground image

Background Image
Color blend in HSV

Color blend in HSI
Well, those look terrible.  White background content is not retained, and the image brightness is severely altered.  What happens with HSL?

Color blend in HSL
Well that looks better.  In fact, that looks exactly like GIMP behaves.  Checking the source code for GIMP 2.8.14, this is exactly how GIMP behaves. Let's look for a moment at why the white content is preserved.  While I previously compared the projected brightness isosurfaces to mislead the reader as I had misled myself, the answer lies in the projection of the saturation isosurfaces.  Simply put, it is the conditional nature of the calculation of S in HSL which creates its bicone geometry and allows comparable S resolution near both the black and white corners of the RGB cube.

Saturation isosurfaces as projected into the RGB cube from HSV, HSI, HSL
So we know how GIMP does it.  What are better ways?  While HSL helps prevent the loss of white image regions, the overall brightness still suffers.  Let's start with the vague suggestion that Photoshop uses CIELAB.  At this point, I can only make educated guesses at the internals, but intuition would suggest that we might try using CIELCHab, the polar expression of CIELAB.  In naivety, I perform a CH swap to obtain the following.

Color blend in CIELCHab
Now things are actually worse.  Both black and white regions are lost.  To understand why, I put together a tool for visualizing the projection of sRGB into other color spaces such as CIELAB.

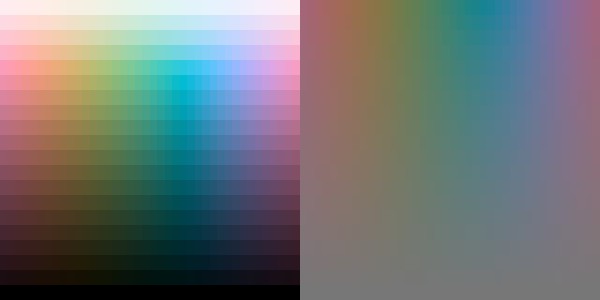
The trajectory of an out-of-gamut point in unconstrained LCHab and HuSLab
Here, we see the volume containing all RGB triplets whose values lie within standard data ranges (e.g. 0-255 for uint8).  Unlike the case with HSV, HSL, and HSI, the sRGB space is a subset of the CIELAB space.  A color point which lies outside the depicted volume would have pixel values that are either negative or larger than allowed by the datatype.  Upon conversion back to RGB, these values would be truncated to the standard range. In this manner, color points outside the cube will be mapped to points on its surface. Since the truncation occurs after conversion to RGB, the trajectory of out-of-gamut color points will be parallel to the axes of the cube.  It then stands to reason that the orientation of the neutral axis means that out-of-gamut points tend to be mapped away from the white and black corners of the cube and toward the primary-secondary edges.

If the goal remains to isolate the effects of color manipulation and image brightness, the geometry of this projection poses an issue.  To transfer the radial position of a primary or secondary corner to a pixel which is near the extent of the L axis would be to push the pixel outside the cube.  If we were to rotate the hue of a pixel which lies on a primary or secondary corner, it would again move outside the cube.  How can we manage the existence and graceful conversion of these points?   To be honest, I'm not sure I know the best methods.  All I can offer are my current approaches.

One approach would be to do data truncation prior to RGB conversion.  Of course, the maximum chroma for a given L and H is not simple to calculate, but this would keep the trajectories of out-of-gamut points in a plane of constant L.  This produces good results, but reveals an issue with working methods.

Color blend in CIELCHab
Ideally, we would try to do all our image operations in the uniform space (LAB/LUV) and only perform the conversion to RGB for final output or screen display.  At the very least, we could convert to RGB with no data truncation, allowing for negative and supramaximal pixel values to retain the information stored by OOG points.  For my efforts in creating standalone tools with RGB input and output, this best approach seems terribly impractical.  When constrained by compatibility with Matlab's image viewer and other image handling functions, we're forced to decide whether it's appropriate to lose chroma information by truncating in LCH.  Even though it causes no ill effects for a single operation, it means that successive operations will tend to compress the chroma content of the image to a small subset of the projected RGB space.

This is more of a problem for image and color adjustment than for a single channel swapping blend operation, but it's something to keep in mind.  I'll probably come back to the topic of normalized versions of LCH at a later date.

If implementing a constrained color model like this is beyond the realm of practical effort-costs, consider this simple dirty method to retain brightness in a color blend.  Simply copy the background luma, perform a HS channel swap in HSL, then re-establish the original luma using your favorite luma-chroma transformation.  This might seem like it would waste a lot of time with converting twice, but it's often the fastest method among those I've described.  The results are similar to the normalized methods, and existing conversion tools can typically be used.

Color blend in HSL with Y preservation
For an example of the methods, feel free to check out the image blending function I've posted on the Mathworks file exchange. The conversion tools for LCHab, LCHuv, HuSLab, HuSLuv, and HSY are included in the parent submission.

Saturday, September 12, 2015

Remove unwanted garbage from YouTube sidebar

Nothing much to say about this one, really.  Eliminate useless clickbait bullshit from the related videos sidebar in YouTube.  Why are there 20 videos for preschool kids in the sidebar when I'm watching a video about running a lathe?  I don't want to see that shit ever again.

The way I look at it, there are at least three classes of video links that can be identified as disposable:
  • Videos from certain channels
  • Videos with an astronomical number of views
  • Videos that are "Recommended"
I eliminate these targets with YARIP.  It might be desired to blacklist more things, but I got tired of stabbing blindly at other attempts while exploring the limited functions of XPATH 1.0.

//li[child::div/a/span[@class="stat attribution"]/span[contains(.,'Busy Beavers')]]
//li[child::div/a/span[@class="stat attribution"]/span[contains(.,'BuzzFeed')]]
//li[child::div/a/span[@class="stat attribution"]/span[contains(.,'Danger Dolan')]]
//li[child::div/a/span[@class="stat view-count" and number(translate(substring-before(.," "),',','')) > 3000000]]
//li[child::div/a/span[@class="stat view-count" and contains(., 'Recommended')]]

The particular channel names and limiting views count can be tailored for your experience and taste. 

Wednesday, July 29, 2015

Read and write animated gifs with MATLAB

UPDATE: These scripts have been vastly improved. Find the current versions here.

In the process of developing my own image mangling toolbox for Matlab, I had routine need for generating animated gif files from image sequences.  It then follows that said .gif files might need to be read back again.  Matlab's inbuilt functions imread() and imwrite() don't make this trivial.  There are some suggestions floating around the internet, and there are some unanswered reports of unexpected behavior.  Not everything worked simply, but I came up with my own ways.

First, writing the image was fairly simple.  I had originally been using imagemagick to do the heavy lifting, but decided to go for a more direct route.  As mentioned, the imagemagick method does seem to have better output, but it's quite a bit slower in my experience.
function gifwrite(inarray,filepath,delay,method)
%   GIFWRITE(INARRAY, FILEPATH, {DELAY}, {METHOD})
%       write image stack to an animated gif
%       
%   INARRAY: 4-D image array (rgb, uint8)
%   FILEPATH: full name and path of output animation
%   DELAY: frame delay in seconds (default = 0.05)
%   METHOD: animation method, 'native' or 'imagemagick' (default = 'native')
%       'imagemagick' may have better quality, but is much slower

if nargin<4;
    method='native';
end

if nargin<3;
    delay=0.05;
end

numframes=size(inarray,4);

if strcmpi(method,'native');
    disp('creating animation')
    for n=1:1:numframes;
        [imind,cm]=rgb2ind(inarray(:,:,:,n),256);
        if n==1;
            imwrite(imind,cm,filepath,'gif','DelayTime',delay,'Loopcount',inf);
        else
            imwrite(imind,cm,filepath,'gif','DelayTime',delay,'WriteMode','append');
        end
    end
else
    disp('creating frames')    
    for n=1:1:numframes;
        imwrite(inarray(:,:,:,n),sprintf('/dev/shm/%03dgifwritetemp.png',n),'png');
    end
    
    disp('creating animation')
    system(sprintf('convert -delay %d -loop 0 /dev/shm/*gifwritetemp.png %s',delay*100,filepath));
    
    disp('cleaning up')    
    system('rm /dev/shm/*gifwritetemp.png');
end
return
Reading the image back wasn't straightforward at all.  The naive approach suggested by the documentation and posts online does not result in correct output.  Imread(...'frames','all') returns only a single colormap corresponding to the global color table in the file. Any file containing multiple images with local color tables will turn into a pile of garbage.
function outpict=gifreadcrap(filepath)
%   GIFREADCRAP(FILEPATH)
%       reads all frames of an animated gif into a 4-D RGB image array
%       seems imread() cannot correctly read animated gifs

[images map]=imread(filepath, 'gif','Frames','all');

s=size(images);
numframes=s(4);

outpict=zeros([s(1:2) 3 numframes],'uint8');
for n=1:1:numframes;
    outpict(:,:,:,n)=ind2rgb8(images(:,:,:,n),map);
end

return
Original image written with gifwrite() and results as returned by gifreadcrap()
Using imread() to read single frames in the hope of perhaps getting correct color information produced the exact same results. Imfinfo() can be used to fetch file information, and certainly, it returns color tables which should correspond to the LCTs in the file. This is where things get ugly.

I spent some time with a hex editor and the file standards documentation to verify what I suspected was a bug. While imfinfo() returned the LCT data, they were all shifted by exactly one byte. The immediately adjacent bytes were being read correctly, though. Sounds like an OBOE to me!

At this point, I discover that yes, indeed it is a bug in versions R14-2012a. A patch exists, but for the sake of anyone who doesn't care, I decided to integrate both the native solution and my own imagemagick workaround.

Keep in mind that it may still be necessary to coalesce the animation before opening it, depending on what you want to do in Matlab. If you're trying to import an optimized gif, you can use the included option to coalesce the image. This optional mode is similar to the other optional modes in these two functions in that it requires external tools and assumes a linux environment. All temporary file operations utilize /dev/shm for marginal speed improvement. Altering this temporary path for your own environment should be trivial. Both functions should work in default modes on other systems, but I have no intention of testing that.
function outpict=gifread(filepath,method,coalesce)
%   GIFREAD(FILEPATH, {METHOD}, {COALESCE})
%       reads all frames of an animated gif into a 4-D RGB image array
%       
%   FILEPATH: full path and filename
%   METHOD: file read method, 'native' or 'imagemagick' (default = 'native')
%       'imagemagick' method is a workaround for bug 813126 present in
%       R14SP3-2012a versions.  Bug consists of an OBOE in reading LCT data.
%       A patch does exist for these versions:
%       https://www.mathworks.com/support/bugreports/813126
%   COALESCE: 0 or 1, Specifies whether to coalesce the image sequence prior to
%       importing.  Used when loading optimized gifs. Requires imagemagick.
%       (optional, default 0)
 
if nargin<3;
    coalesce=0;
end
if nargin<2;
    method='native';
end
 
 
if coalesce==1
    system(sprintf('convert %s -layers coalesce /dev/shm/gifreadcoalescetemp.gif',filepath));
    filepath='/dev/shm/gifreadcoalescetemp.gif';
end
 
if strcmpi(method,'native')
    % use imread() directly (requires patched imgifinfo.m)
    [images map]=imread(filepath, 'gif','Frames','all');
    infostruct=imfinfo(filepath);
 
    s=size(images);
    numframes=s(4);
 
    outpict=zeros([s(1:2) 3 numframes],'uint8');
    for n=1:1:numframes;
        LCT=infostruct(1,n).ColorTable;
        outpict(:,:,:,n)=ind2rgb8(images(:,:,:,n),LCT);
    end
else
    % split the gif using imagemagick instead
    system(sprintf('convert %s /dev/shm/%%03d_gifreadtemp.gif',filepath));
    [~,numframes]=system('ls -1 /dev/shm/*gifreadtemp.gif | wc -l');
 
    numframes=str2num(numframes);
    [image map]=imread('/dev/shm/000_gifreadtemp.gif', 'gif');
    s=size(image);
 
    outpict=zeros([s(1:2) 3 numframes],'uint8');
    for n=1:1:numframes;
        [image map]=imread(sprintf('/dev/shm/%03d_gifreadtemp.gif',n-1), 'gif');
        outpict(:,:,:,n)=ind2rgb8(image,map);
    end
 
    system('rm /dev/shm/*gifreadtemp.gif');
end
 
if coalesce==1
    system(sprintf('rm %s',filepath));
end
 
return
While all of this works, the native reading method does require either a patched copy of imgifinfo.m or Matlab version 2012b or later. Of course, once the existence of the bug was known, fixing things was simple. All the hours over the last day and a half that I spent digging for answers online and with a hex editor were to only rediscover something that was already known but hidden behind MathWorks' member login. It kind of pisses me off enough that finding the solution does not resolve my focus. What possible purpose does restricting access to bug reports serve?

If there's one thing I should have learned from my experiences with asking things of forums, it's to never ask forums. The internet is littered with the evidence of my inability to learn this simple lesson. This very blog was an angry reaction to the previous spectacularly infuriating experience. If I'm bound to ask questions of a silent screen -- if I'm bound to carve my own conclusions and place them on them complete on someone else's mantle in the meager hope that I can help the next person avoid my fate, then I might as well do it in a squalor of my own crafting, without the unrealistic expectations of interaction tugging at my attention.

Monday, July 20, 2015

Toward a useful vision aid

Ever since cataract surgery, I've been struggling with being able to see well.  Part of the issue is a gradual increase in astigmatism since surgery (I just need to get my prescription updated), but the biggest hurdle is the loss of visual accommodation.

With the extraction of the eye's natural lens, goes the ability to adjust focus to accommodate for distance.  While corrective lenses can bring things into focus for any fixed distance (e.g. reading glasses), a fixed correction can't work over a broad range of distances.  As depth of field increases as a function of distance to subject, it stands to reason that most accommodation issues occur when working with nearby objects.  An older person feeling the effects of presbyopia can probably say a thing or two about the gradual frustration of needing bifocals.

This isn't about age-related problems or old people things. This is about my dumb broke ass trying to find a means to get by with my pointless daily existence. Anyone else would probably just buy some magnifier lamps or something, but those cost double-digits kind of money. If you've been paying attention, you'll know that I'll end up cobbling shit out of $0.99 Ebay garbage and then sitting in the dark at midnight writing rambling stories to myself about an experience that even I can barely care about. That's what I did. That's what I'm doing. Let us continue.

Presbyopia is common though.  Where do most people start?  Bifocals and reading glasses simply offer an increased optical power (increased lens convexity) so that focusing on near objects is possible.  While bifocals are convenient in that they're always at hand, their use requires a strong downward gaze which I can't effectively accomplish -- a consequence of an entirely separate ailment.

A drift of reading glasses and very uncomfortable Optivisor clone

Drug store reading glasses aren't meant to be used with prescription glasses, though it's ... possible.  Prescription reading glasses are a simple addition to the SPH portion of the prescription (or specification of a +ADD).  Of course, if you know your prescription and can use cheap readers to get an idea how much correction you need for a particular distance, you can do the math yourself and order any sort of odd double-reader bifocals or "computer glasses" you want.

For instance, let's say I wear plain single-vision glasses and I pick up a pair of +2.5 readers and slap them over the top.  "Hooray!" I say as I can again read my own handwriting at 12".  I can either add 2.5 to the SPH portion of both OD and OS lines on my prescription, or if it's appropriate, I can just use the +ADD entry on the order form.  In this way, you can order your own readers or bifocals online without dealing with extra expense.

Say I have an existing bifocal prescription and I want to make computer glasses that can focus at 30", but without changing the power of the secondary lens I normally use for reading at 15".  If I can determine that a +1.50 correction allows me to see at 30", I can just add that to the SPH section of the prescription and then subtract it from the existing +ADD which specified the original bifocals.   Zenni Optical actually covers these sorts of prescription adjustments in their FAQ here and here

Granted, buying glasses from Zenni beats paying $200 for glasses, but I'm not made of money.  Not only that, but like I mentioned, depth of field is a function of distance.  With glasses configured to focus at 20', you can focus at 200', but with glasses configured to focus at 2', you probably won't be able to see much at 20'.  I went though the motions I describe above when I got my glasses for the computer.  In fact, I collected the optimal focusing distance for a range of positive correction powers, as well as the minimum and maximum distance I could reasonably make out detailed edges in some text samples.  It seems subjective at a glance, but when plotted, the trend starts to reveal a nice rational relationship.


With some use-cases such as the computer where distance is fixed and repeatable, it's simple to come up with a correction that's tailored to the task.  Otherwise, shop work involving operations up close (checking pitch of a bolt with a thread gage) and at a distance (finding the bolt after you drop it) is hard to correct with a single prescription.  At some point one has to accept that there is no single solution, and that carrying numerous solutions around is impractical. 

So what's left?  If I can't accommodate and I can't effectively use bifocals, I'm pretty much doomed to do half of my work in a blurry world unless I'm constantly swapping glasses or fumbling a magnifier.  Some work patterns are harder to deal with than others.  Automotive work requires focus between about 12" and 60", and the area of focus is typically changing regularly.  On the other hand, lathe operations cover a smaller range of distances and most importantly, the critical areas of focus don't change as much.  It's simpler to try coming up with task-oriented magnification tools for cases like this.  ... simpler to try.

So I embark on a journey to come up with some positionable magnetic work magnifiers that I can stick down on the lathe or drill press or vise when I need them.  There are lots of options out there already if you want to spend money.  Certainly, I'd like a lighted magnifier on a Noga mag base, but that's not going to happen.


I found a MagniStitch magnifier that my late grandparents had purchased in the 80's.  The lens is well-shaped and wide.  The ball-jointed arm is much less useful than one might think.  It tends to pop apart when positioning.  I glued it to an old speaker magnet (because double-sided foam tape is bullshit).  These can still be purchased for about $13-$20.  I've considered buying others if perhaps I can CAD up a more appropriate articulated arm for it.

MagniStitch stuck on the drill press vise

The MagniStitch didn't work well for me on the lathe simply because the arm is too short to reach around the tool post or to reach around the cross slide to see the dial.  I considered making my own from an inexpensive pocket magnifier and a flexible arm of some sort.  The trouble with buying cheap magnifiers is that a lot of them are completely useless shapes.  That is to say that they are neither spherical or hyperbolic lens profiles, but they're molded or ground to some freehand wavy biconic shape that makes them about as useful as a fishbowl.  I found some glass pocket magnifiers on Ebay that have proven to be good.  I just popped the rivet out of one and made a wire arm for it.  It works well enough, but it tends to wobble if it's on a machine that vibrates.  It needs a stiffer wire or some dampening ... or maybe I just need to replace the bad belts in the lathe.  It's a promising candidate though.

Pretending to put a shear cut on some trashy porous cast aluminum bar

In the course of scouring china-mart for lens-shaped objects, I saw this thing and thought I had a brilliant idea.  Increasing illumination helps a lot, partly because pupilary contraction increases depth of field.  I could slap a USB power bank of some sort onto that and have a little portable magnifier light.  Well, not really.  The lenses in these things are absolutely useless.  Luckily, it wasn't molded directly into the lamp.


Freehand wavy biconic lens-shaped object

I ended up taking another one of my glass pocket magnifiers and grinding the lens down to replace it.  The gooseneck is barely able to hold the lamp up anyway, and the USB connector really is a lousy mechanical support.  By the time I had the replacement lens fitted, I had pretty much condemned the USB power bank and the whole idea.  I glued it to another magnet and figured I'll use it until I come up with something better.


It's easy to fix the lens.  Just inherit an old lapidary wet grinder...

These aren't the best solutions, but they'll keep me busy for now.  I plan on whipping up an articulated arm system in CAD.  I'd like something simple that I can machine, but it might be nice to come up with a printable modular system. 

If you're looking for a more substantial conclusion to this rambling post, there isn't one.  These are not unique problems.  Although it might be difficult for someone in good health to understand how frustrating and disempowering the experience of poor vision can be, plenty of people have it worse than I do. 

Saturday, July 18, 2015

Animate a plot in MATLAB

As part of an ongoing exercise in pointlessly observing unavoidable disasters, I use a script to log the status of my internet connection via the information provided by the DSL modem.  Normally, I just process this data into a pdf of daily plots of SNR and connection speed with average figures for each day.  It's not too pretty, but it gets the point across easily enough.


For other aspects of the data, or maybe just to satisfy an idle whim, I thought it might be more interesting to visualize the data in motion. I had been playing with more complex figure manipulation recently, so I thought it would be a good challenge.  I created a figure containing two axes which shows connection speed as well as signal and noise power.  For simplicity, I used subplot_tight(), but there are other simplified methods of getting decent custom geometry out of figures with multiple axes.  The background marking the days is generated simply:

% all the other data is prepared first
days=single(mod(round((t-12)/24),2)); % used to mark days

figure(1); clf; 
subplot_tight(4,1,2:4,0.05)
area(t,40*days-20,-20,'facecolor',0.9*[1 1 1],'edgecolor',[1 1 1]); hold on;
plot(t,PWRfill,'r:',t,NOISEfill,'b:',t,PWR,'r',t,NOISE,'b'); grid on; 
ax1=gca; 
set(gca,'layer','top'); % otherwise area() hides grid
xlabel('time (hours)'); ylabel('power (dBm)');

subplot_tight(4,1,1,0.05); 
area(t,1500*days,0,'facecolor',0.9*[1 1 1],'edgecolor',[1 1 1]); hold on;
plot(t,SPD); ax2=gca; set(gca,'layer','top'); grid on;
ylabel('Connection Speed kbps');

set(ax2,'XTickLabelMode', 'Manual','XTickLabel',[])

% keep subplots correlated on x when zooming
linkaxes([ax1 ax2],'x');

In the end, I decided against using the grid lines.  They clutter the animation too much in my opinion.  I left them in this code example simply to demonstrate the use of the 'Layer' property when using area() plots.

This also shows the overlay of duplicate datasets.  The original data as logged contains thousands of gaps where the modem stopped reporting valid data, either because the connection was down or because the modem had locked up.  While metrics like connection speed are only sensible to consider while the connection status is valid, things like noise power would really be most interesting at the extremes -- when the modem can't connect.  I used inpaint_nans() to fill only the small gaps in the data, leaving longer gaps unfilled on the assumption that they represent modem lockups.

3-10-15 to 7-18-15 overall plot before animation

 Once the figure is established with linked axes and everything is as desired, the animation routine incrementally steps through the data by setting the x-axis limits and capturing a frame as a .png file on disk.  Matlab has an inbuilt function for generating movies (as an array of structs) and writing them as an .avi.  In practice, this is a horrible burden on both ram and disk.  For a video containing roughly 1300 frames, this method required a 4.9GB memory footprint and created an even larger uncompressed .avi file.  The avifile() function can't utilize any compression in a linux environment, so it's pretty much useless to me.  Caching images as png keeps memory use from scaling with frame count, and it allows external tools to do the video work.  For some reason, Matlab does a much better job of creating png files than jpg files; they're much smaller too.

%% animate a plot
% assume axes are time-coordinated and linked
% acts generically only on one axis

width=36; % window width in hours
framestep=0.5; % time step between frames
outputdir='/home/assbutt/cad_and_projects/modemplots/';

% keep axes from autoscaling
a0=gca;
a=findall(gcf,'type','axes');
for n=1:1:length(a);
    axes(a(n));
    axis manual
end
axes(a0); % return to original axis

nframes=ceil((max(t)-width)/framestep)
perh=length(t)/max(t); % actual number of samples per hour
xlim=[0 width];
for f=1:1:nframes;
    set(gca,'xlim',xlim);

    % place a date label in the middle of the figure
    fdate=lineArray(round(perh*mean(xlim))); % date of center sample
    h=text(-100,0,sprintf('%s',fdate{:}),'horizontalalignment','center');
    set(h,'units','normalized','position',[0.5 -0.1 0],'fontsize',12);

    % image height is trimmed to an even pixel for video encoding
    pause(0.05); frame=getframe(gcf);
    frame.cdata=255-frame.cdata; sf=size(frame.cdata);
    imwrite(frame.cdata(1:end-(mod(sf(1),2)),:,:), ...
        [outputdir 'frame_' sprintf('%04d',f) '.png'],'png');

    xlim=xlim+framestep; delete(h);
end

I invert the image data during write because I normally use Matlab with the screen inverted. It's too easy for me to create plots that are difficult to read unless they stay that way.

The animation is a bit obnoxious because it grabs window focus constantly and makes it difficult to do anything else with the computer.  I simply ran it on a second machine to avoid the hassle.  Once everything was on disk, I compiled a video with avconv, though I suppose I could have gone directly to OpenShot with the image set.

avconv -r 24 -i frame_%04d.png -c:v libx264 -pix_fmt yuv420p out.mp4

I threw some extra titles and such on the ends using OpenShot and kicked it to YouTube so that it has somewhere to sit and collect dust.


Overall, I think the method works and helps get a point across.  It's easy to see the transition in the noise characteristics over time.  It's easy to identify the mid-day instability of the connection.  I should have used a thicker linewidth when plotting things; scaled down, it gets difficult to see details and read text.  Apologies for the blurriness.

Of course, maybe you don't want to lock axis scaling; maybe you want to change different aspects of the plot over the image sequence.  The point is just to show that getframe() exists and avifile() is a fat ugly pig.  Everything else is just hammering at graphics object properties in a loop.  

I guess it's only appropriate

As I tried to explain last time, I consider this habit to be a unilateral affair.  Until now, I'd no need to create a decoder.  Out of curiosity, I decided to go ahead and make one; it was easy enough.  To think all this time I hadn't known of base2dec().  I've been doing shit the hard way too many times.  Oh well.  Learning things is good.

%% text from unicode pictogram (arbitrary-base encoding)
clc; clear all; 
format compact

instring='▄▆▂▆ ▄█▄▄ ▄▆█▂ ▄▆█▂ ▄█▂█ ▄▆▆▂ ▄▆▆▄ ▄█▄▂';
charmap='▂▄▆█'; % length(charmap)=b
space=' '; % thin space

b=length(charmap);
for n=0:1:b-1;
    instring(findstr(instring,charmap(n+1)))=num2str(n);
end

instring(findstr(instring,space))=' ';
instring=str2num(instring); % simplifies indexing
outstring='';

for n=1:1:length(instring);
    outstring=[outstring char(base2dec(num2str(instring(n)),b))];
end

outstring


It works well enough.  I suppose I could make it automagically find a minimal character set from the input pictogram string, but it wouldn't have any way of guessing the likely order.  Granted, even a human would have to guess if the charmap used in encoding weren't conspicuously ordered. 

Thursday, July 16, 2015

▒░▒▓▓ ▒░▒▓▒ ▒▒░▓░ ▒░▓▓▓

▄▂▂▄ ▄█▂█ ▂▆▂▂ ▄▆█▄ ▄█▄▄ ▄▆▂█ ▄▆▆▂ ▂▆▂▂ ▄▆▂▄ ▄█▂█ ▂▆▂▂ ▄▂▆▄ ▂▆▂▂ ▄▆█▄ ▄▆▂▄ ▄█▆▄ ▂▆▂▂ ▄▆▆▂ ▄▆▂▄ ▄█▄▆ ▄▆▄▄ ▂▆▂▂ ▄▆▄▄ ▄▆█▆ ▄▆▆▆ ▄▆██ ▄█▆▄ ▄▆▄▄ ▄▆▄▂ ▂▆▂▂ ▄▆▂█ ▄▆▄▄ ▄█▂▆ ▄█▄▂ ▄▆▂▄ ▄▆▆▄ ▄▆█▆ ▂▆▂▂ ▄█▄▂ ▄▆▆▂ ▄▆▆▄ ▄▆█▆ ▄▆▄█ ▄█▂█ ▂▆▂▂ ▄▆▆▄ ▄▆█▆ ▂▆▂▂ ▄█▂▂ ▄▆▂▄ ▄█▂▆ ▄█▄▂ ▄▆▆▄ ▄▆▂█ ▄█▄▄ ▄▆█▂ ▄▆▂▄ ▄█▂▆ ▂▆█▂ ▂▆▂▂ ▄▂▆▄ ▂▆▄█ ▄█▄▆ ▄▆▄▄ ▂▆▂▂ ▄▆▆▂ ▄▆▂▄ ▄▆▄▂ ▂▆▂▂ ▄▆▂▄ ▂▆▂▂ ▄▆▄█ ▄█▂▆ ▄▆██ ▄█▄█ ▄▆▆▄ ▄▆█▆ ▄▆▄█ ▂▆▂▂ ▄▆▄▂ ▄▆▆▄ ▄▆▄▆ ▄▆▄▆ ▄▆▆▄ ▄▆▂█ ▄█▄▄ ▄▆█▂ ▄█▄▂ ▄█▆▄ ▂▆▂▂ ▄▆▄▄ ▄▆█▆ ▄▆▆▆ ▄▆██ ▄█▆▄ ▄▆▆▄ ▄▆█▆ ▄▆▄█ ▂▆▂▂ ▄▆▂▄ ▄▆█▆ ▄█▆▄ ▄█▄▂ ▄▆▆▂ ▄▆▆▄ ▄▆█▆ ▄▆▄█ ▂▆▂▂ ▄▆▆▄ ▄▆█▆ ▂▆▂▂ ▄▆▄█ ▄▆▄▄ ▄▆█▆ ▄▆▄▄ ▄█▂▆ ▄▆▂▄ ▄▆█▂ ▂▆█▆ ▂▆▂▂ ▂▆▂▂ ▄▂▆▄ ▄█▄▂ ▂▆▂▂ ▄▆▂█ ▄█▂▆ ▄▆▄▄ ▄▆▄▄ ▄█▂▂ ▄█▂█ ▂▆▂▂ ▄▆▆▄ ▄▆█▆ ▄█▄▂ ▄▆██ ▂▆▂▂ ▄▆▄▄ ▄█▄▆ ▄▆▄▄ ▄█▂▆ ▄█▆▄ ▄█▄▂ ▄▆▆▂ ▄▆▆▄ ▄▆█▆ ▄▆▄█ ▂▆█▂ ▂▆▂▂ ▄▆▄▆ ▄█▂▆ ▄▆██ ▄▆█▄ ▂▆▂▂ ▄▆█▄ ▄█▆▄ ▂▆▂▂ ▄▆▄▂ ▄█▂▆ ▄▆▄▄ ▄▆▂▄ ▄▆█▄ ▄█▂█ ▂▆▂▂ ▄█▄▂ ▄▆██ ▂▆▂▂ ▄▆█▄ ▄▆▄▄ ▄▆█▄ ▄▆██ ▄█▂▆ ▄█▆▄ ▂▆█▆ ▂▆▂▂ ▂▆▂▂ ▄▄▄█ ▄▆▆▄ ▄█▄▂ ▄▆▆▂ ▂▆▂▂ ▄█▄█ ▄▆▂▄ ▄▆█▆ ▄▆▆▄ ▄▆█▆ ▄▆▄█ ▂▆▂▂ ▄▆▂█ ▄▆██ ▄▆█▆ ▄▆▄▆ ▄▆▆▄ ▄▆▄▂ ▄▆▄▄ ▄▆█▆ ▄▆▂█ ▄▆▄▄ ▂▆█▂ ▂▆▂▂ ▄▂▆▄ ▂▆▂▂ ▄▆▄▆ ▄▆▄▄ ▄▆▄▄ ▄▆█▂ ▂▆▂▂ ▄▆▂▄ ▄█▂█ ▂▆▂▂ ▄█▄▂ ▄▆▆▂ ▄▆██ ▄█▄▄ ▄▆▄█ ▄▆▆▂ ▂▆▂▂ ▄▂▆▄ ▂▆▂▂ ▄▆▆▂ ▄▆▂▄ ▄█▄▆ ▄▆▄▄ ▄▆█▆ ▂▆▄█ ▄█▄▂ ▂▆▂▂ ▄█▄▂ ▄▆▆▂ ▄▆▄▄ ▂▆▂▂ ▄▆▂▆ ▄█▂▆ ▄▆▄▄ ▄▆▂▄ ▄█▄▂ ▄▆▆▂ ▂▆▂▂ ▄█▄▂ ▄▆██ ▂▆▂▂ ▄▆▄▄ ▄█▄▆ ▄▆▄▄ ▄▆█▆ ▂▆▂▂ ▄▆▄▄ ▄█▆▂ ▄█▂▂ ▄█▂▆ ▄▆▄▄ ▄█▂█ ▄█▂█ ▂▆▂▂ ▄█▄▂ ▄▆▆▂ ▄▆▂▄ ▄█▄▂ ▂▆▂▂ ▄▂▆▄ ▂▆▂▂ ▄▆▂█ ▄▆▂▄ ▄▆█▆ ▂▆▄█ ▄█▄▂ ▂▆▂▂ ▄▆▂█ ▄▆▂▄ ▄█▂▆ ▄▆▄▄ ▂▆▂▂ ▄▆▂▆ ▄▆▄▄ ▄█▆▄ ▄▆██ ▄▆█▆ ▄▆▄▂ ▂▆▂▂ ▄█▄▂ ▄▆▆▂ ▄▆▄▄ ▂▆▂▂ ▄█▂▆ ▄▆▄▄ ▄▆█▄ ▄▆▂▄ ▄▆▆▄ ▄▆█▆ ▄▆▆▄ ▄▆█▆ ▄▆▄█ ▂▆▂▂ ▄▆▄▂ ▄▆▆▄ ▄█▂█ ▄▆▄█ ▄█▄▄ ▄█▂█ ▄█▄▂ ▂▆▂▂ ▄▆██ ▄█▂▆ ▂▆▂▂ ▄█▂▆ ▄▆▄▄ ▄▆▄█ ▄█▂▆ ▄▆▄▄ ▄█▄▂ ▂▆█▆ 

▄▄▂█ ▄█▄▂ ▄▆▆▄ ▄▆█▂ ▄▆█▂ ▂▆█▂ ▂▆▂▂ ▄█▄▂ ▄▆▆▂ ▄▆▆▄ ▄█▂█ ▂▆▂▂ ▄▆▂▄ ▄▆█▆ ▄▆▆▄ ▄▆█▄ ▄▆▂▄ ▄▆█▂ ▂▆▂▂ ▄▆█▆ ▄▆▄▄ ▄▆▄▄ ▄▆▄▂ ▂▆▂▂ ▄█▄▂ ▄▆██ ▂▆▂▂ ▄▆▂█ ▄▆██ ▄▆█▄ ▄▆█▄ ▄█▄▄ ▄▆█▆ ▄▆▆▄ ▄▆▂█ ▄▆▂▄ ▄█▄▂ ▄▆▄▄ ▂▆▂▂ ▄█▄█ ▄▆▄▄ ▄▆█▂ ▄▆█▂ ▄█▂█ ▂▆▂▂ ▄▆▄▆ ▄█▂▆ ▄▆██ ▄▆█▄ ▂▆▂▂ ▄█▄█ ▄▆▆▄ ▄█▄▂ ▄▆▆▂ ▄▆▆▄ ▄▆█▆ ▂▆█▆ ▂▆▂▂ ▂▆▂▂ ▄▂▂▄ ▄█▂█ ▂▆▂▂ ▄▆▂▄ ▂▆▂▂ ▄▆█▄ ▄▆▂▄ ▄█▂█ ▄█▄▂ ▄█▄▄ ▄█▂▆ ▄▆▂▆ ▄▆▂▄ ▄█▄▂ ▄▆▆▄ ▄▆██ ▄▆█▆ ▂▆▂▂ ▄▆██ ▄▆▄▆ ▂▆▂▂ ▄▆█▆ ▄▆▄▄ ▄▆▂█ ▄▆▄▄ ▄█▂█ ▄█▂█ ▄▆▆▄ ▄█▄▂ ▄█▆▄ ▂▆█▂ ▂▆▂▂ ▄▂▆▄ ▂▆▂▂ ▄▆▂█ ▄▆██ ▄▆█▆ ▄█▄▂ ▄▆▆▄ ▄▆█▆ ▄█▄▄ ▄▆▄▄ ▂▆▂▂ ▄█▄▂ ▄▆██ ▂▆▂▂ ▄▆▄█ ▄▆██ ▂▆▂▂ ▄█▄▂ ▄▆▆▂ ▄█▂▆ ▄▆██ ▄█▄▄ ▄▆▄█ ▄▆▆▂ ▂▆▂▂ ▄█▄▂ ▄▆▆▂ ▄▆▄▄ ▂▆▂▂ ▄▆█▄ ▄▆██ ▄█▄▂ ▄▆▆▄ ▄▆██ ▄▆█▆ ▄█▂█ ▂▆█▆ ▂▆▂▂ ▂▆▂▂ ▄▂▆▄ ▄▆▄▆ ▂▆▂▂ ▄█▄▂ ▄▆▆▂ ▄▆▄▄ ▂▆▂▂ ▄▆▄▂ ▄█▂▆ ▄▆▆▄ ▄█▄▆ ▄▆▆▄ ▄▆█▆ ▄▆▄█ ▂▆▂▂ ▄▆▂█ ▄▆██ ▄▆█▆ ▄▆▄▆ ▄▆█▂ ▄▆▆▄ ▄▆▂█ ▄█▄▂ ▂▆▂▂ ▄█▂▆ ▄▆▄▄ ▄▆█▄ ▄▆▂▄ ▄▆▆▄ ▄▆█▆ ▄█▂█ ▂▆▂▂ ▄▆▆▄ ▄▆█▆ ▄█▄▂ ▄▆▄▄ ▄█▂▆ ▄▆█▆ ▄▆▂▄ ▄▆█▂ ▂▆█▂ ▂▆▂▂ ▄▆▂▄ ▄▆█▆ ▄▆▄▂ ▂▆▂▂ ▄▆█▆ ▄▆██ ▂▆▂▂ ▄▆▄▄ ▄█▆▂ ▄█▄▂ ▄▆▄▄ ▄█▂▆ ▄▆█▆ ▄▆▂▄ ▄▆█▂ ▂▆▂▂ ▄▆▄▄ ▄█▆▂ ▄█▂▂ ▄▆▄▄ ▄▆▂█ ▄█▄▂ ▄▆▂▄ ▄█▄▂ ▄▆▆▄ ▄▆██ ▄▆█▆ ▄█▂█ ▂▆▂▂ ▄▆▄▄ ▄█▆▂ ▄▆▆▄ ▄█▂█ ▄█▄▂ ▂▆█▂ ▂▆▂▂ ▄▆▂▄ ▄▆█▂ ▄▆█▂ ▂▆▂▂ ▄█▂▂ ▄█▂▆ ▄▆▄▄ ▄█▄▂ ▄▆▄▄ ▄▆█▆ ▄█▂█ ▄▆▄▄ ▂▆▂▂ ▄▆▂▄ ▄█▂█ ▂▆▂▂ ▄▆▂█ ▄▆██ ▄▆█▄ ▄▆█▄ ▄█▄▄ ▄▆█▆ ▄▆▆▄ ▄▆▂█ ▄▆▂▄ ▄█▄▂ ▄▆▆▄ ▄▆██ ▄▆█▆ ▂▆▂▂ ▄▆█▄ ▄▆▂▄ ▄█▆▄ ▂▆▂▂ ▄▆▂▄ ▄█▂█ ▂▆▂▂ ▄█▄█ ▄▆▄▄ ▄▆█▂ ▄▆█▂ ▂▆▂▂ ▄▆▂▆ ▄▆▄▄ ▂▆▂▂ ▄▆▂▄ ▄▆▂▆ ▄▆▂▄ ▄▆█▆ ▄▆▄▂ ▄▆██ ▄▆█▆ ▄▆▄▄ ▄▆▄▂ ▂▆█▆ 

▄▂▂▄ ▄▆█▆ ▄▆▄▂ ▂▆▂▂ ▄█▂█ ▄▆██ ▂▆▂▂ ▄▆▆▄ ▄█▄▂ ▂▆▂▂ ▄▆▄█ ▄▆██ ▄▆▄▄ ▄█▂█ ▂▆▂▂ ▄▆▂▄ ▄█▄▂ ▂▆▂▂ ▄█▄▂ ▄▆▆▄ ▄▆█▄ ▄▆▄▄ ▄█▂█ ▂█▆█ ▂▆▂▂ ▂▆▂▂ ▄▆▂▄ ▄█▂█ ▂▆▂▂ ▄▆▄▄ ▄▆▂▄ ▄█▂█ ▄▆▆▄ ▄▆█▂ ▄█▆▄ ▂▆▂▂ ▄▆▂▄ ▄█▂█ ▂▆▂▂ ▄▆██ ▄▆█▆ ▄▆▄▄ ▂▆▂▂ ▄▆▂█ ▄▆▂▄ ▄▆█▆ ▂▆▂▂ ▄▆▆▂ ▄▆██ ▄▆█▂ ▄▆▄▂ ▂▆▂▂ ▄▆▄▂ ▄▆▆▄ ▄▆▂▄ ▄▆█▂ ▄▆██ ▄▆▄█ ▄█▄▄ ▄▆▄▄ ▂▆▂▂ ▄█▄█ ▄▆▆▄ ▄█▄▂ ▄▆▆▂ ▂▆▂▂ ▄▆▂▄ ▄▆█▆ ▂▆▂▂ ▄▆▄▄ ▄▆█▄ ▄█▂▂ ▄█▄▂ ▄█▆▄ ▂▆▂▂ ▄█▂▆ ▄▆██ ▄▆██ ▄▆█▄ ▂▆█▂ ▂▆▂▂ ▄▂▆▄ ▂▆▂▂ ▄▆▂▆ ▄█▂▆ ▄█▄▄ ▄█▂█ ▄▆▆▂ ▂▆▂▂ ▄▆▂▄ ▄█▂█ ▄▆▆▄ ▄▆▄▂ ▄▆▄▄ ▂▆▂▂ ▄█▄▂ ▄▆▆▂ ▄▆▄▄ ▂▆▂▂ ▄▆▂▄ ▄█▂█ ▄█▂█ ▄█▄▄ ▄▆█▄ ▄█▂▂ ▄█▄▂ ▄▆▆▄ ▄▆██ ▄▆█▆ ▂▆▂▂ ▄█▄▂ ▄▆▆▂ ▄▆▂▄ ▄█▄▂ ▂▆▂▂ ▄▆█▄ ▄█▆▄ ▂▆▂▂ ▄█▄█ ▄▆██ ▄█▂▆ ▄▆▄▂ ▄█▂█ ▂▆▂▂ ▄█▄█ ▄▆▆▄ ▄▆█▂ ▄▆█▂ ▂▆▂▂ ▄▆▂▆ ▄▆▄▄ ▂▆▂▂ ▄█▂▆ ▄▆▄▄ ▄▆▂▄ ▄▆▄▂ ▂▆█▆ ▂▆▂▂ ▂▆▂▂ ▄▂▂▄ ▄█▂█ ▂▆▂▂ ▄▆▂▄ ▄▆█▆ ▄█▆▄ ▂▆▂▂ ▄█▂▂ ▄█▂▆ ▄▆██ ▄█▂▂ ▄▆▂▄ ▄▆▄█ ▄▆▂▄ ▄▆█▆ ▄▆▄▂ ▄▆▆▄ ▄█▂█ ▄█▄▂ ▂▆▂▂ ▄█▄█ ▄▆▆▄ ▄▆█▂ ▄▆█▂ ▂▆▂▂ ▄▆▄▂ ▄▆▄▄ ▄▆█▂ ▄▆▆▄ ▄▆▄█ ▄▆▆▂ ▄█▄▂ ▂▆▂▂ ▄█▄▂ ▄▆██ ▂▆▂▂ ▄▆▄▂ ▄▆▄▄ ▄▆█▆ ▄█▆▄ ▂▆█▂ ▂▆▂▂ ▄▆█▄ ▄▆▂▄ ▄▆▆█ ▄▆▆▄ ▄▆█▆ ▄▆▄█ ▂▆▂▂ ▄█▂█ ▄█▄▄ ▄█▂▆ ▄▆▄▄ ▂▆▂▂ ▄█▄▂ ▄▆▆▂ ▄▆▂▄ ▄█▄▂ ▂▆▂▂ ▄█▄█ ▄▆██ ▄█▂▆ ▄▆▄▂ ▄█▂█ ▂▆▂▂ ▄▆▂▄ ▄█▂▆ ▄▆▄▄ ▂▆▂▂ ▄▆█▄ ▄▆▄▄ ▄▆▂▄ ▄▆█▆ ▄▆▆▄ ▄▆█▆ ▄▆▄█ ▄▆█▂ ▄▆▄▄ ▄█▂█ ▄█▂█ ▂▆▂▂ ▄▆▆▄ ▄█▂█ ▂▆▂▂ ▄█▄▂ ▄▆▆▂ ▄▆▄▄ ▂▆▂▂ ▄▆▄▆ ▄▆▆▄ ▄█▂▆ ▄█▂█ ▄█▄▂ ▂▆▂▂ ▄█▂█ ▄█▄▂ ▄▆▄▄ ▄█▂▂ ▂▆▂▂ ▄█▄▂ ▄▆██ ▄█▄█ ▄▆▂▄ ▄█▂▆ ▄▆▄▂ ▂▆▂▂ ▄▆▄▄ ▄█▂█ ▄█▄▂ ▄▆▂▄ ▄▆▂▆ ▄▆█▂ ▄▆▆▄ ▄█▂█ ▄▆▆▂ ▄▆▆▄ ▄▆█▆ ▄▆▄█ ▂▆▂▂ ▄▆██ ▄█▂▆ ▂▆▂▂ ▄▆▂▄ ▄▆▂█ ▄▆▆█ ▄▆█▆ ▄▆██ ▄█▄█ ▄▆█▂ ▄▆▄▄ ▄▆▄▂ ▄▆▄█ ▄▆▆▄ ▄▆█▆ ▄▆▄█ ▂▆▂▂ ▄█▄▂ ▄▆▆▂ ▄▆▄▄ ▂▆▂▂ ▄▆█▄ ▄▆▄▄ ▄▆▂▄ ▄▆█▆ ▄▆▆▄ ▄▆█▆ ▄▆▄█ ▄▆█▂ ▄▆▄▄ ▄█▂█ ▄█▂█ ▄▆█▆ ▄▆▄▄ ▄█▂█ ▄█▂█ ▂▆▂▂ ▄▆██ ▄▆▄▆ ▂▆▂▂ ▄▆▂▄ ▄▆▂█ ▄█▄▂ ▄▆▆▄ ▄▆██ ▄▆█▆ ▂▆█▆ 

% text to unicode pictogram (arbitrary-base encoding)
clc; clear all; 
format compact

instring=sprintf('And of course, I used Matlab to do it!');
charmap='▂▄▆█'; % length(charmap) determines numeric base
space=' '; % thin space

outstring='';
newchar='';
b=length(charmap);
bs=ceil(log(128)/log(b));
for n=1:1:length(instring);
    nc=double(instring(n));
    for m=1:1:bs;
        bitstring=floor(mod(nc,b^m)/b^(m-1));
        for k=0:1:bs-1;
            if bitstring==k
                newchar=[charmap(k+1) newchar];
            end
        end
    end
    
    outstring=[outstring newchar space];
    newchar='';
end
outstring

▄▂▂▄ ▄▆█▆ ▄▆▄▂ ▂▆▂▂ ▄▆██ ▄▆▄▆ ▂▆▂▂ ▄▆▂█ ▄▆██ ▄█▄▄ ▄█▂▆ ▄█▂█ ▄▆▄▄ ▂▆█▂ ▂▆▂▂ ▄▂▆▄ ▂▆▂▂ ▄█▄▄ ▄█▂█ ▄▆▄▄ ▄▆▄▂ ▂▆▂▂ ▄▂█▄ ▄▆▂▄ ▄█▄▂ ▄▆█▂ ▄▆▂▄ ▄▆▂▆ ▂▆▂▂ ▄█▄▂ ▄▆██ ▂▆▂▂ ▄▆▄▂ ▄▆██ ▂▆▂▂ ▄▆▆▄ ▄█▄▂ ▂▆▂▄